Data-Driven Theater vs. Data-Driven Decision Making
BLUF | Many organizations confuse looking data-driven with being data-driven; only genuine decision ecosystems deliver measurable impact and resilience.
How do you know whether your organization is practicing data-driven decision making...or simply performing data-driven theater? The difference matters more than ever. Despite years of investment, only 37% of enterprises describe themselves as data- and AI-driven in 2025¹. This gap shows how easy it is for organizations to fall into the trap of looking data-driven without actually becoming so. Being data-driven represents potential energy; Decision Intelligence is the actuation of that energy, turning awareness into intelligent action. The real challenge lies in moving past appearances and ensuring every data point connects directly to decisions that matter.
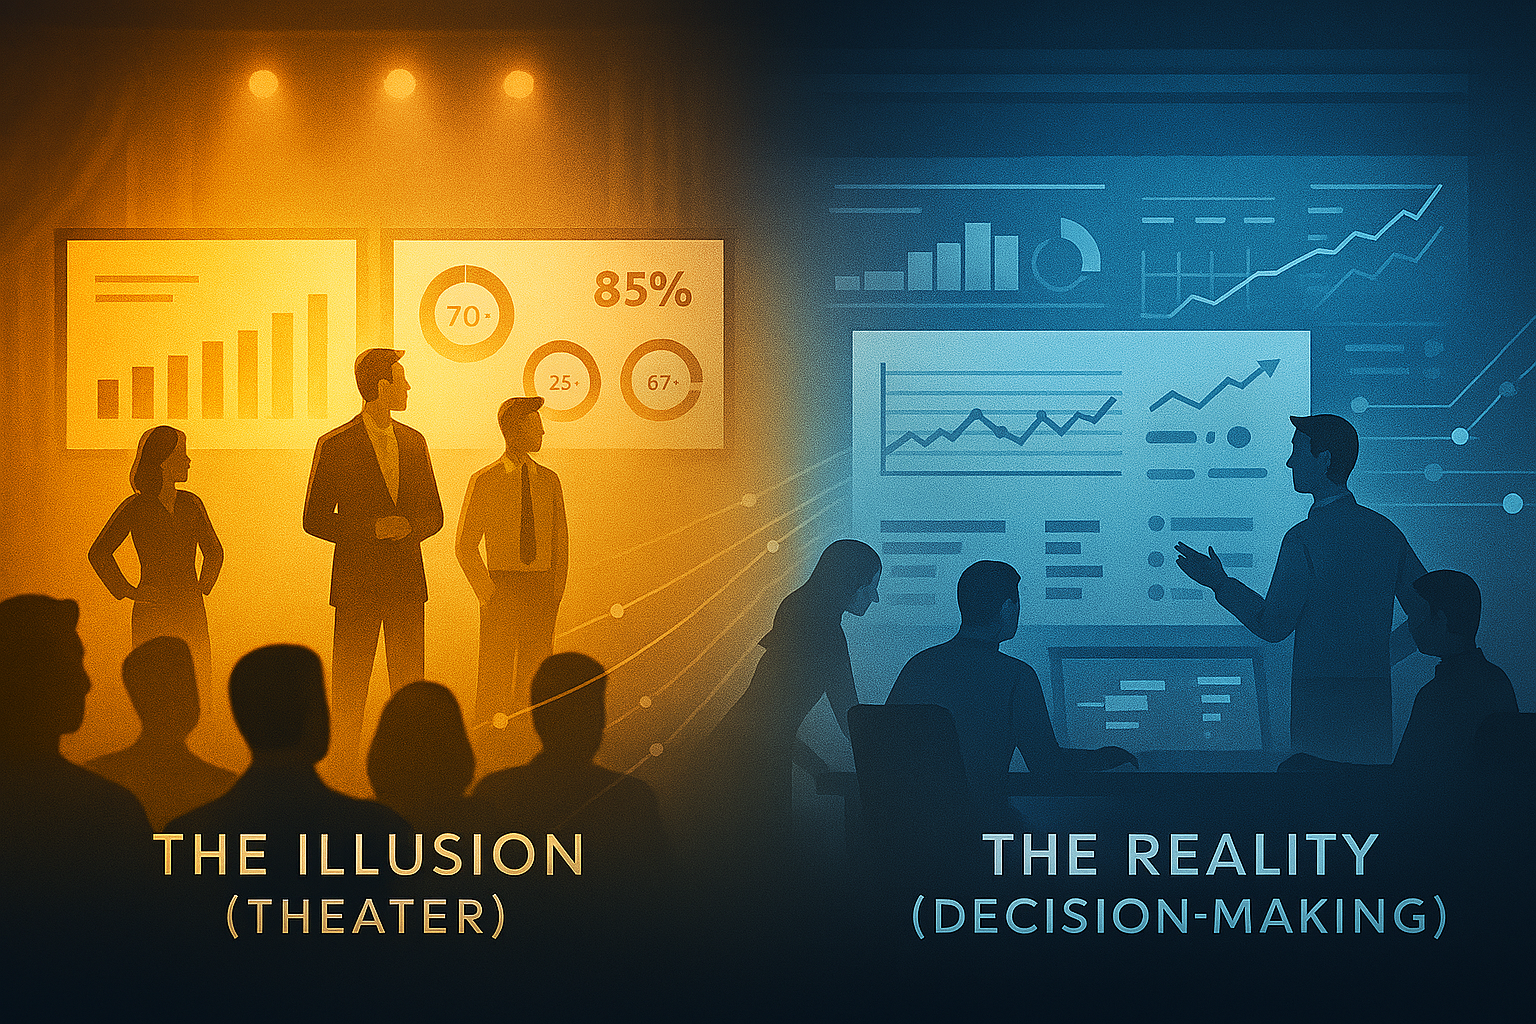
The Illusion: Theater
Data-driven theater thrives on optics. Organizations build dashboards, host reviews, and generate slides that look convincing but fail to guide action. Leaders may equate more slides/charts with better insight, yet numbers without context provide little direction. Vendors showcase glossy dashboards highlighting seasonal fluctuations or aggregate outputs but miss the deeper “so what” behind the numbers. Theater delivers awareness, but not accountability. It creates the feeling of progress while reinforcing cycles of performative analysis. In these environments, unresolved performance gaps linger, decisions default back to intuition, and organizations drift further from genuine improvement. Vanity measures dominate, and the harder questions, are we achieving our goals, and why or why not, go unanswered.
Case Study: The Cost of Awareness
In 2018, I was part of a large interagency team preparing a 93-slide executive briefing for a four-star general. My own contribution was only two or three slides, but the experience was eye-opening and it would turn out this wasn't a one off experience. As we moved through dry runs and prep sessions, I started wondering; how much collective time, talent, and cost went into producing this single presentation?
So, I ran the numbers.
The analysis painted a revealing picture of the hidden cost of “data-driven theater.”
- Total preparation cost: $241,881.80 (2018 dollars)
- Total preparation time: 772 hours — nearly five full work months
- Meetings and dry runs: 14 sessions totaling $43,433
- Developer-to-bureaucracy ratio: 1:3 — for every hour spent creating slides, three were spent reviewing, vetting, or updating them
The resulting deck did its job, it informed senior leadership and reflected the organization’s current status. Yet it was fundamentally a rearview-mirror exercise, focused on awareness rather than decision-making. It offered insight into what had happened, not what should happen next.
That realization marked a turning point for me. The effort, while well-intentioned, revealed the structural inefficiency of many “data-driven” processes: enormous energy devoted to building artifacts of understanding, but little investment in converting those artifacts into action. The real opportunity wasn’t in making better slides...it was in designing better systems for translating data into decisions.(image generated with AI)(image generated with AI)
The Reality: Decisions
Breaking free from theater requires a shift from demonstration to deliberation. Real data-driven decision making begins with a clear decision statement: what must we decide, why now, and what success looks like. From there, organizations build reliable pipelines and embed feedback loops to test whether actions change outcomes. Consider a small defense agency, which built forecasting models aligning missions, funding, and identification priorities. Leaders moved from manual data pulls and Excel with static slides to live data feeds, enabling real-time prioritization of global recovery operations. Or the Air Force, which developed a $954M, 30-year range modernization strategy by integrating cost, mission, safety, and joint-service priorities. This effort represented an early form of Decision Intelligence (DI)...integrating diverse data sources and foresight modeling to guide long-term planning. These cases show what is possible when organizations stop admiring dashboards and start embedding data into their operating rhythm building an action-to-outcome DI process. Technology alone does not create the difference; intentional strategy and accountability do.
Spotting Substance
Leaders can tell the difference by asking: is this a stat, a metric, or a performance measure? Stats describe, metrics compare, and performance measures drive action over time. When leaders see a number, they should be able to connect it to a decision, an accountable owner, and a timeframe for change. Think of data and decisions as two sides of the same coin. One side shows the numbers and metrics, the visible data. The other side reflects the confidence, quality, and governance that make those numbers trustworthy. For instance, control charts help distinguish signal from noise, ensuring leaders do not overreact to normal fluctuations. Equally important, confidence in decisions depends on confidence in data quality, the other side of the coin. Without governance, metadata, and validation, even the best-looking metric erodes trust. Dashboards failing to answer “what happens next” are theater. Dashboards highlighting gaps, enabling response, and tracking improvements are substance. These capabilities form part of the foundation for Decision Intelligence, where data meets intent through structured reasoning and feedback.
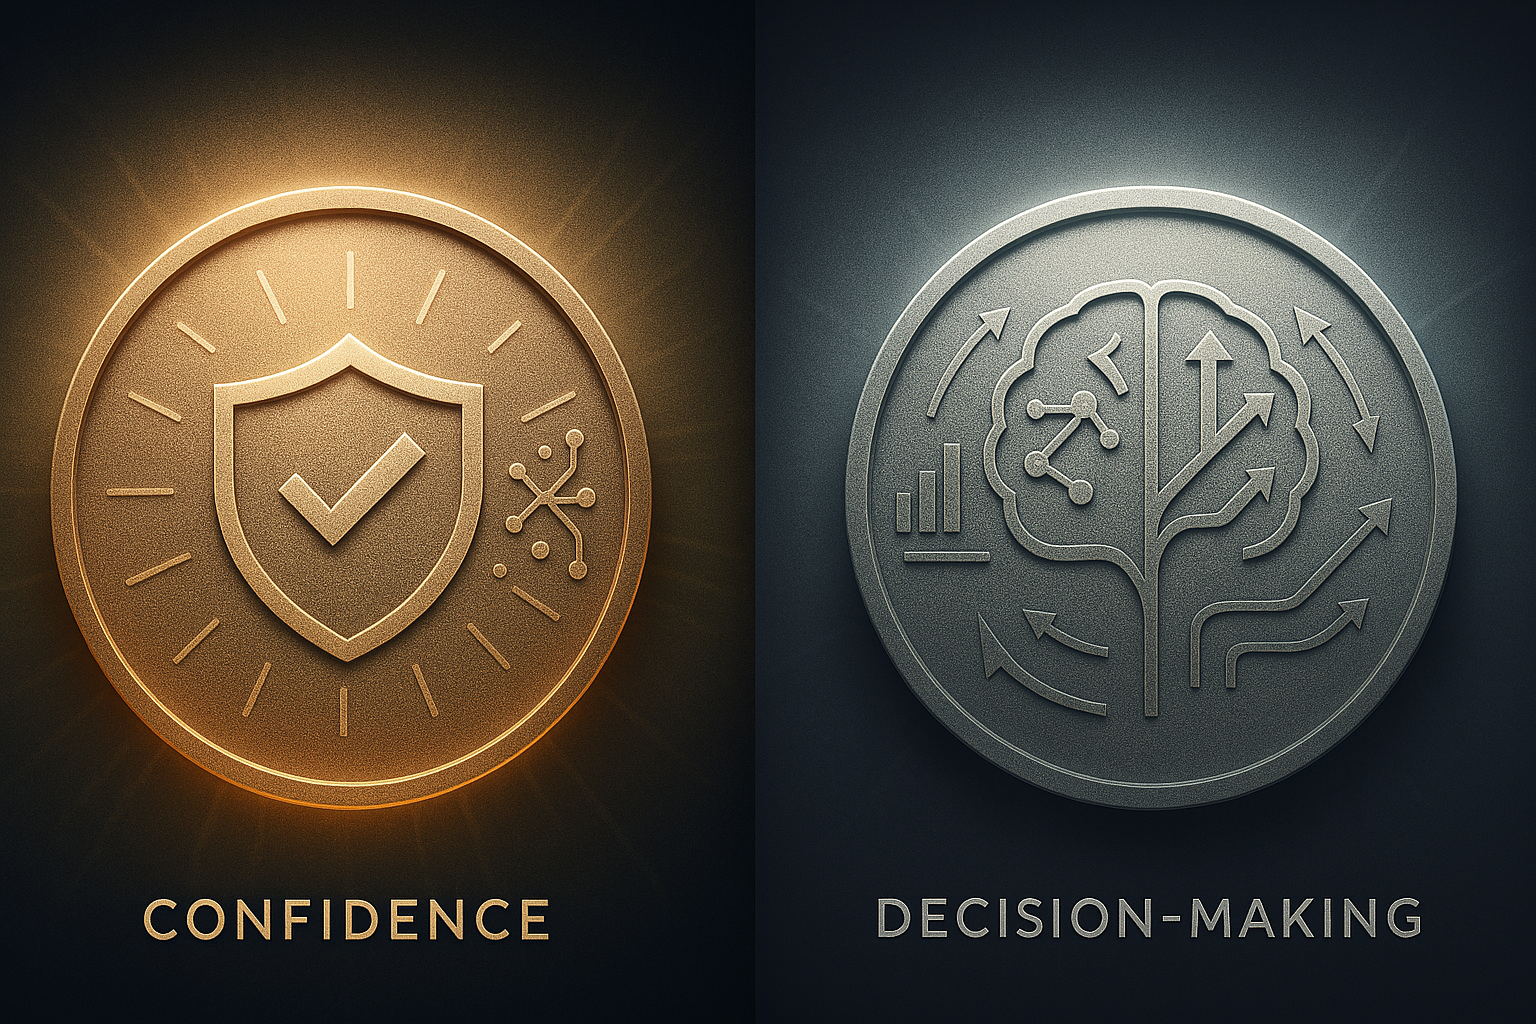
A dual-sided emblem of trust and logic, where confidence meets data-driven decision-making (image generated with AI)
The Digital Efficiency Journey
Authentic change means embracing intelligent transformation, where data and decisions move together across the enterprise. The journey toward the Leader box in the digital efficiency matrix (learn more about the matrix here The Unending Quest for Efficiency: Navigating Beyond Digital Transformation) emerges when organizations minimize theater and maximize impact, ensuring insights produce outcomes improving missions, operations, or customer experiences. The journey can be framed through the 5Cs of Intelligent Transformation:
- Cognition: Define outcomes, decision rights, and guardrails, aligning augmented intelligence with strategy and objectives.
- Capability: Develop people and leadership skills, creating pathways that embed competency and sustain improvement.
- Culture: Reinforce behaviors, incentives, and adoption patterns that make data-driven habits part of everyday work.
- Connectivity: Integrate data sources, platforms, processes, and workflows, enabling interoperability and automation across functions.
- Continuity: Establish governance, risk, and resilience, embedding ethics, security, and continuous improvement into decisions.
Purpose: turn data, AI, and operations into reliable decisions across the lifecycle. Outcome: insight amplified, decisions empowered. The 5Cs provide a practical compass for leaders who want to move beyond vanity dashboards toward measurable transformation, and together, they serve as an operating model for implementing Decision Intelligence at scale.
Leadership Imperative
Data theater is not a method. It dazzles but rarely delivers measurable improvements or enduring organizational learning. General (ret.) Gordon R. Sullivan, in his book Hope Is Not a Method (1997), emphasized that hope is not a method². The same lesson applies here: theater cannot replace genuine strategy. Leaders must identify evangelists, launch manageable initiatives, and build momentum through iteration. Each cycle compounds, shifting culture from reactive demonstration to proactive decision-making. Decision Intelligence transforms theater into traction, embedding forecasting, scenario planning, and consequence modeling directly into leadership forums. Evidence must replace entertainment, and courage must replace complacency. Theater entertains, but decision-making wins campaigns. Organizations that separate optics from impact build resilience, trust, and enduring strategic advantage.
So, ask yourself: What’s our developer-to-bureaucracy ratio?
References
- MIT Sloan Management Review. Five Trends in AI & Data Science for 2025 by Randy Bean. Link Used for: 37% of enterprises describe themselves as data- and AI-driven in 2025.
- Sullivan, Gordon R. Hope Is Not a Method: What Business Leaders Can Learn from America’s Army. 1997. Link Used for: “Hope is not a method” leadership lesson.
